My homelab in my pocket: PiDash is in TestFlight, and I need 50 testers
It’s been a while since the last post. That’s because I was building something: PiDash, an iPhone app for running a homelab from your pocket. It’s in TestFlight now, and I’m looking for 50 beta testers with a lab to point it at.
Website: pidash.io
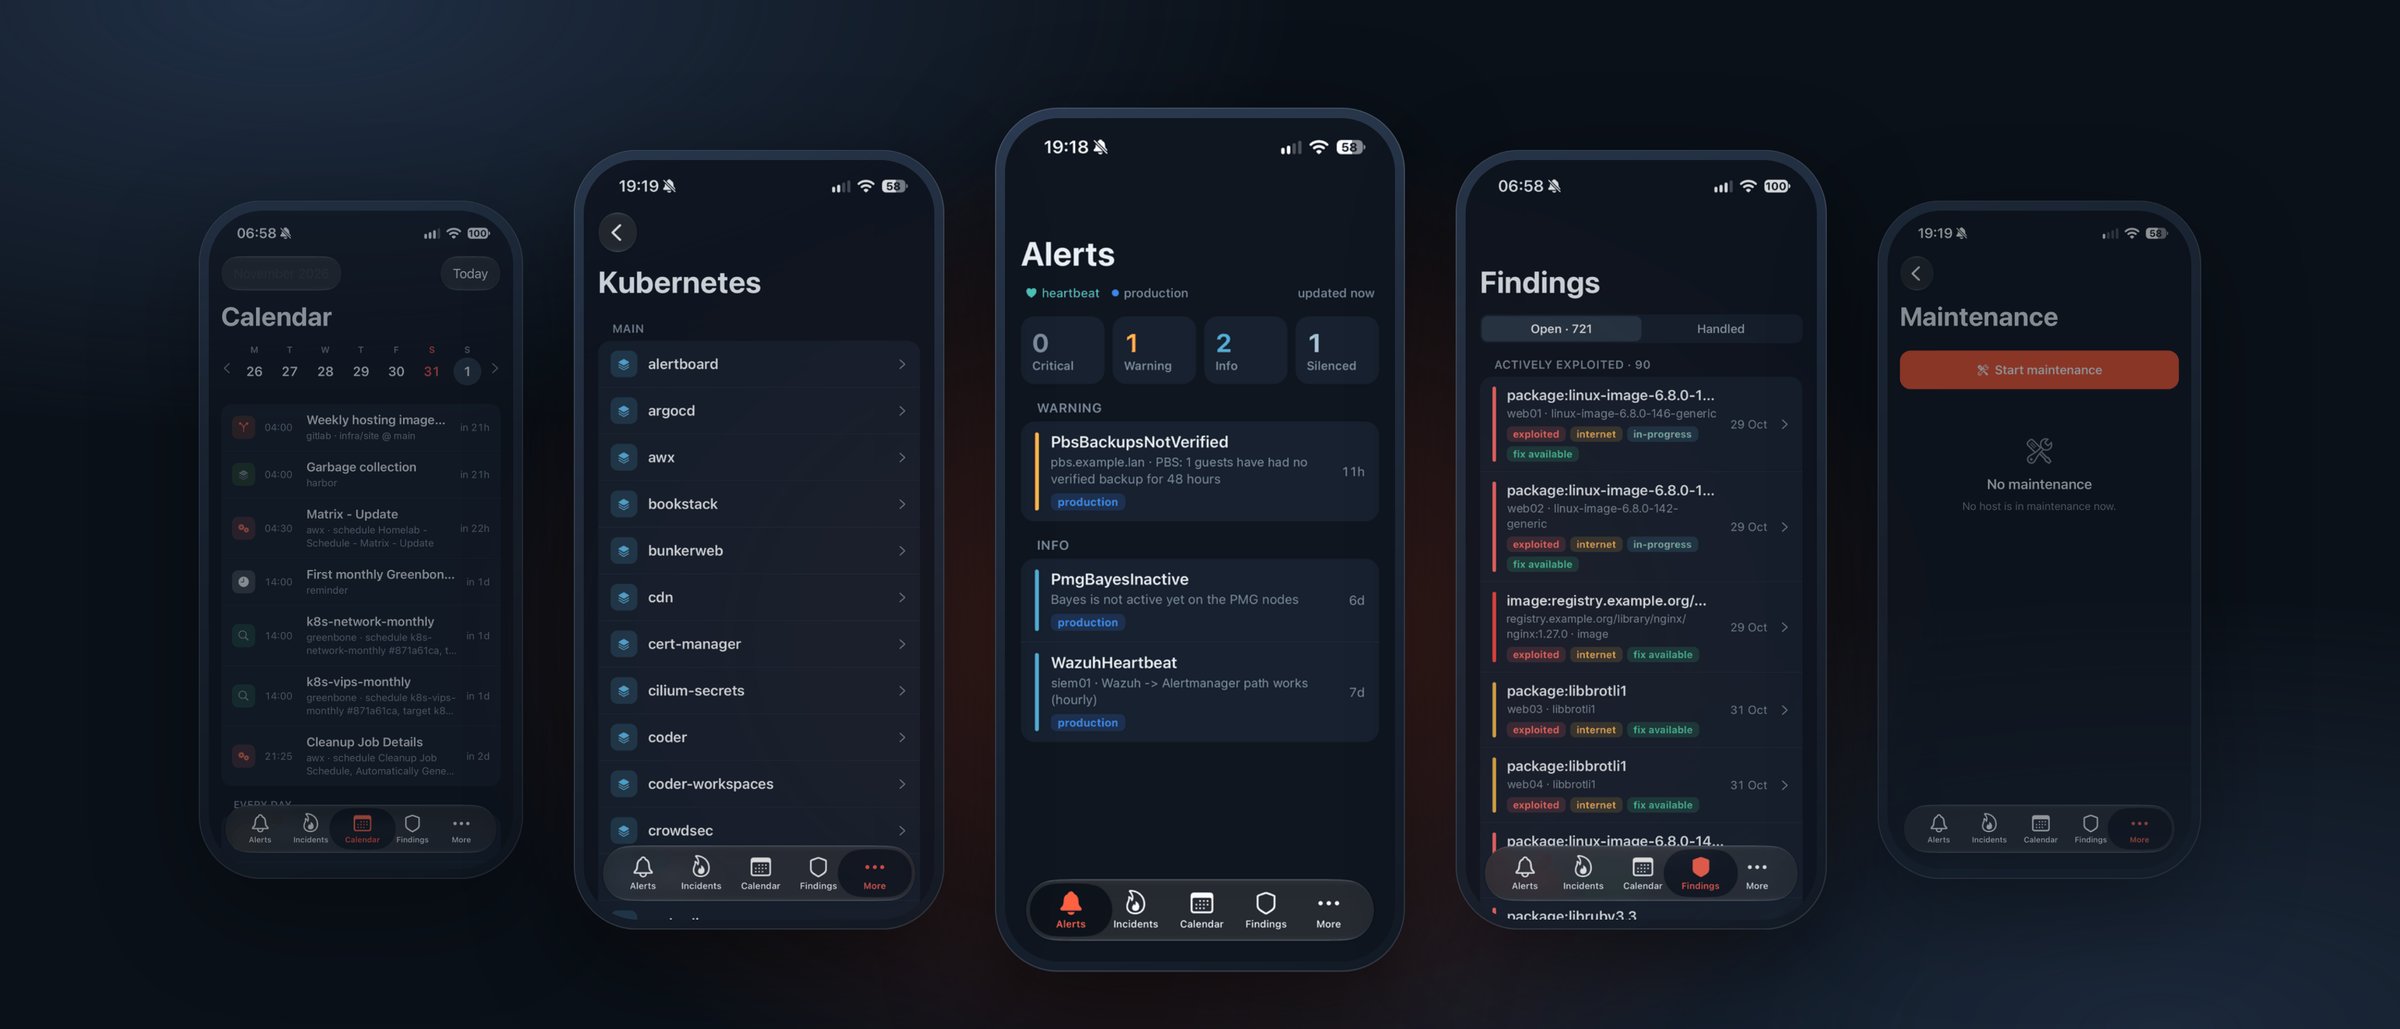
The goal
My homelab isn’t just mine anymore. People use it every day: the password manager, the photo library, websites I host for others. When something breaks, they notice. But I also have a day job, and running the lab shouldn’t turn into a second one. I don’t want to drop what I’m doing and open a laptop every time something wants attention.
And something always does. An alert in Prometheus, an AWX workflow waiting for approval, a pod in a crash loop, a vulnerability scan that found something new. All of that lives in a dozen different web UIs, each with its own login, and none of them are pleasant on a phone.
What I wanted was one place on my phone where I could see what’s wrong and do the small things that fix it in a minute, between meetings: ack an alert, silence it for a few hours, approve a workflow, restart a deployment, open a shell on a VM. Without carrying API keys, SSH keys or a kubeconfig around on the phone.
That last part shaped the whole design.
Two parts: the board and the app
PiDash is two things that work together.
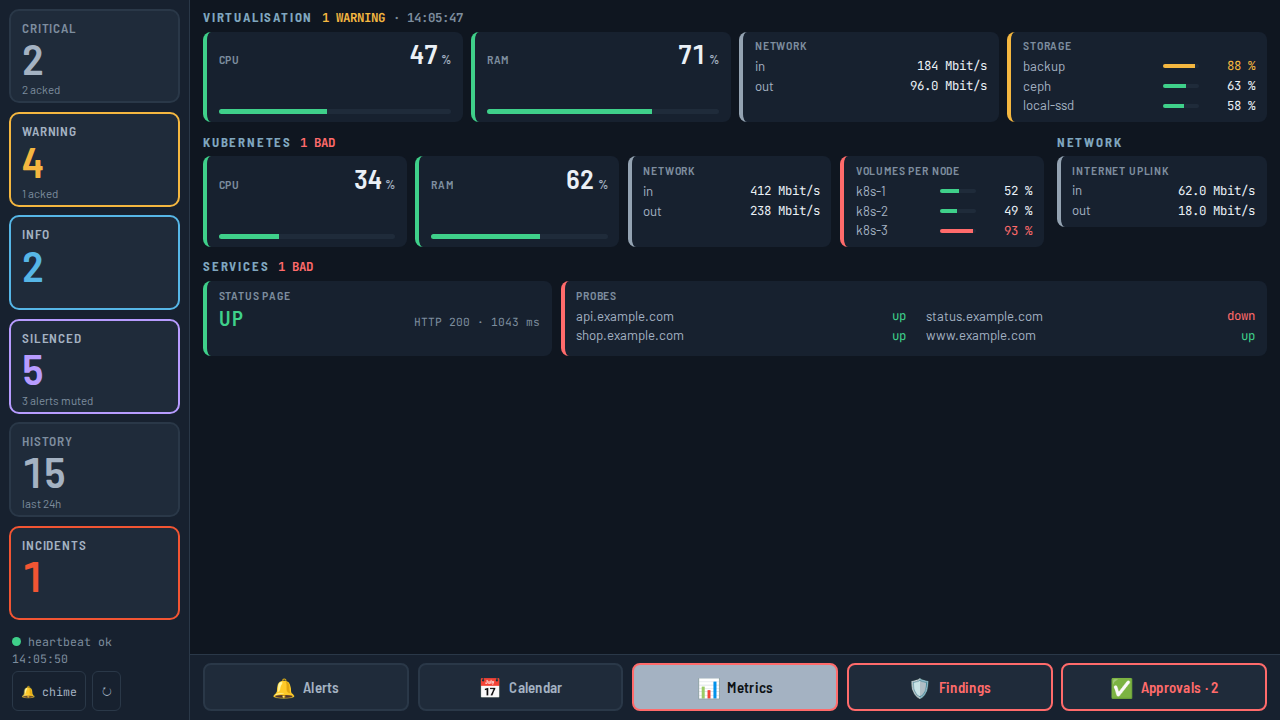
The board is a small server, one Docker Compose project made for a Raspberry Pi 4 or 5 (any Linux machine works too). It holds the API keys, the SSH key and the kubeconfig, talks to your homelab’s systems, and logs who did what. It also doubles as a wall board on a Pi touchscreen, readable from across the room.
The app is a native iPhone app that talks only to your board. It never talks to Alertmanager, Kubernetes or your hosts directly.
 iPhone app  ──HTTPS──▶  the board on the Pi  ──▶  Alertmanager, Prometheus,
 (Face ID,               (config, secrets,          Kubernetes, SSH hosts,
  push)                   MariaDB)                  your networks, AWX, …
So if I lose my phone, what’s on it is a session token for my board in the iOS keychain. No credentials for anything else. Every action that changes something asks for Face ID first.
What it does
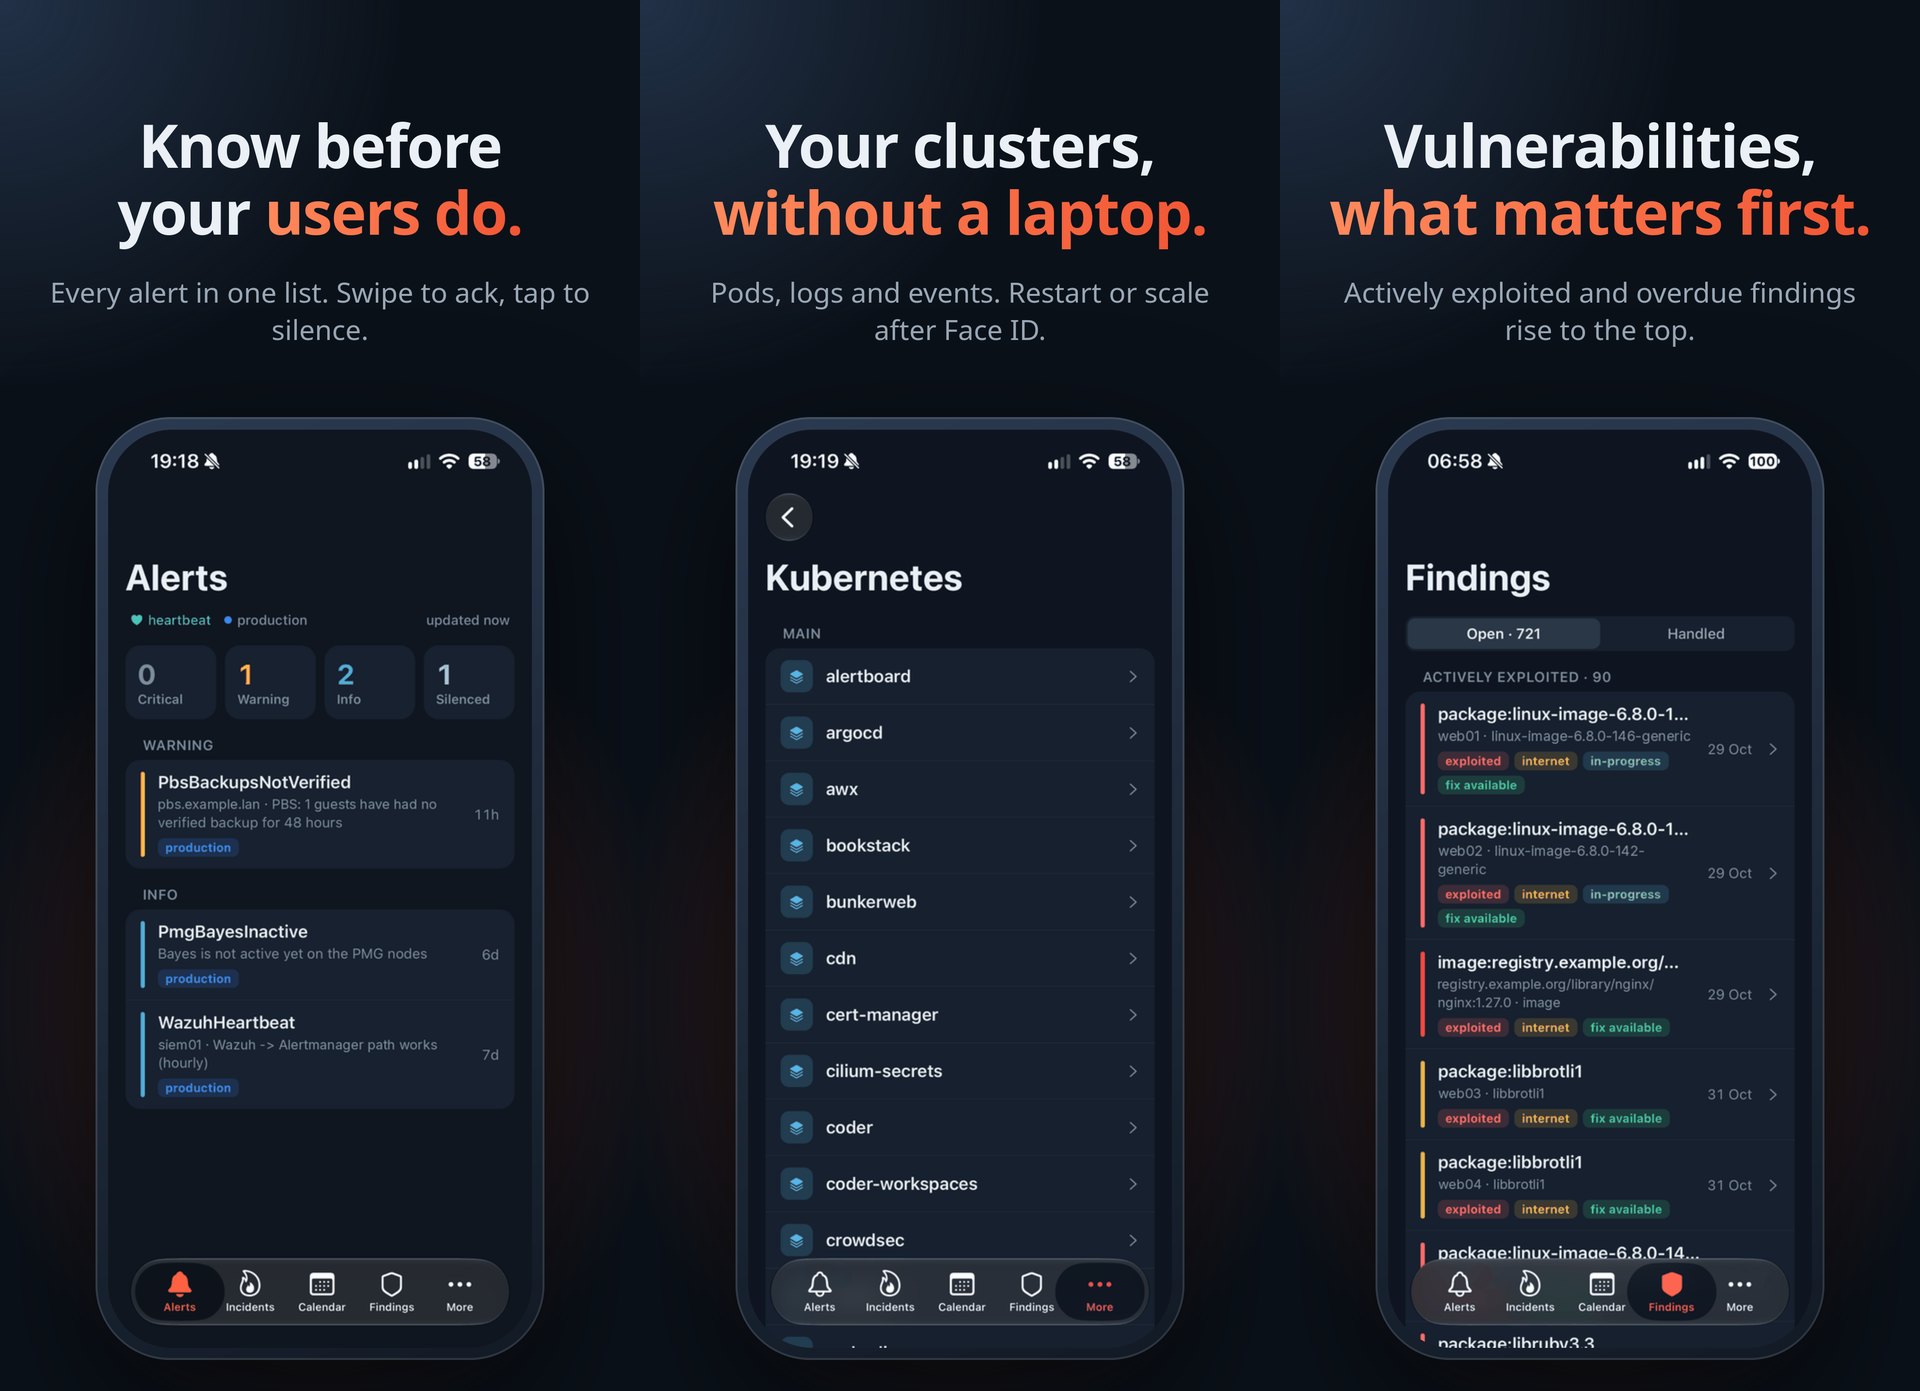
Alertmanager and Prometheus is the main thing you need and what i recommend using. Everything else is an optional connection, and a feature without its connection simply stays off.
- Alerts from one or more Alertmanagers: ack, silence for a while, see the last 24 hours, and put a host in maintenance so its alerts stay quiet.
- Push notifications for alerts as soon as they fire, with Ack right on the notification.
- Incidents in OneUptime: declare one from an alert, move it through its states and publish it on the status page.
- Kubernetes: browse namespaces, workloads, pods, events and logs. Restart, scale, run a CronJob now or delete a pod, as far as the cluster’s RBAC allows.
- SSH terminal on your Proxmox VMs and containers. The board makes the connection, so the phone holds no SSH key.
- AWX approvals and runbooks: approve workflow steps, and launch the job templates you allow, with their live output.
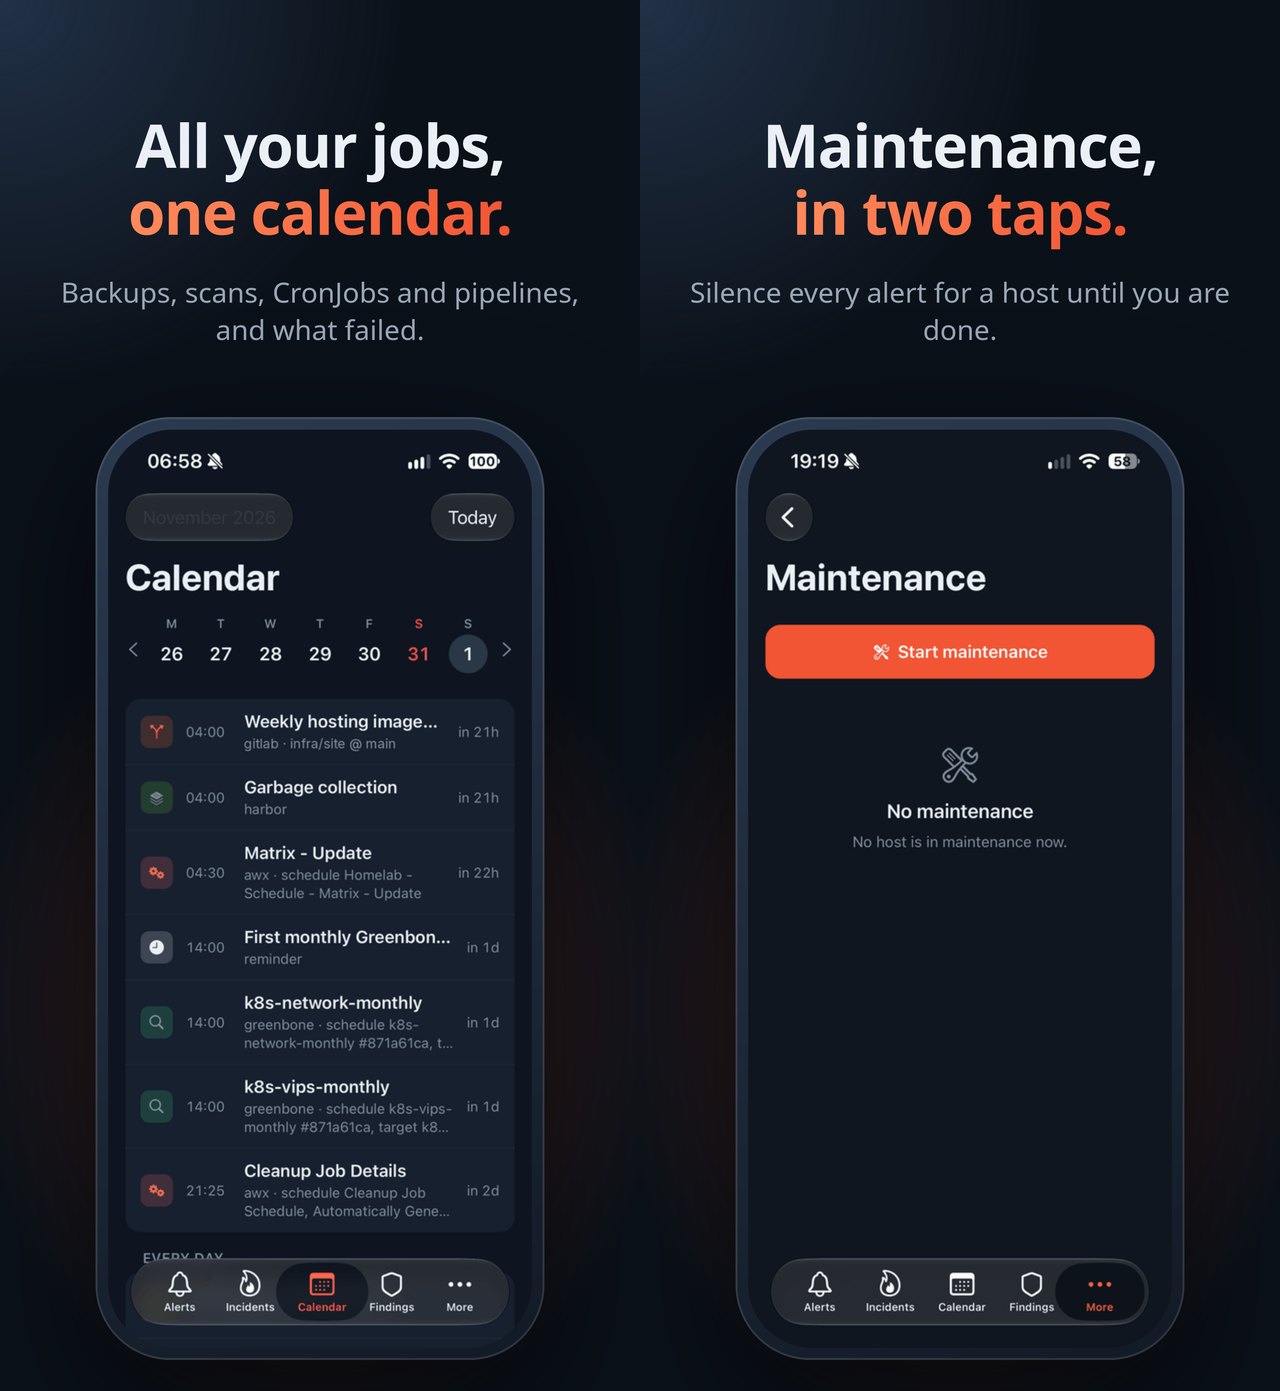
- Calendar of every scheduled job, read from the systems that run them: AWX, Proxmox backups, CronJobs, Longhorn, Harbor, GitLab and Greenbone, with whether each run succeeded.
- Security findings from Greenbone and Wazuh, actively exploited and overdue first.
- Metrics tiles for Proxmox, Kubernetes, storage and probes, with a chart per tile.
- Networks: the devices on your networks and their open ports.
One thing to be clear about: PiDash shows and starts the automation you already have; it doesn’t write it for you. Approvals, runbooks and the AWX jobs on the calendar only appear when the Ansible roles, playbooks, job templates and workflows (with their approval steps) already exist in your AWX. The app reads them and lets you approve or launch them from your phone. To help you get started, I’ll publish some of my own on this blog soon (more on that below). No AWX? Then those screens stay off, and the rest works fine without them.
Login goes through your own OIDC provider. I use Authentik, Keycloak or any other OIDC provider should also work. Groups decide who can only look, who can act and who can open a terminal, so a whole team can use one board.
Your data stays yours
There’s no PiDash cloud, no account with me and no analytics. The app talks to your board, and the board talks to your systems.
The one exception is push notifications. Apple only delivers pushes signed
with the app’s own key, and I can’t hand that key to every board. So boards
push through a small relay at push.pidash.io. But the board encrypts every
notification for one phone (X25519 and AES-256-GCM, with a key that only
that phone holds), so the relay and Apple only see ciphertext and a fixed
“PiDash: New notification” text. A Notification Service Extension in the app
decrypts it on the phone. The relay keeps no database and no logs.
The board also doesn’t have to face the internet. On your LAN or behind a VPN works fine.
How I built it
The board started on 6 October as something much smaller: a read-only Alertmanager screen on a Raspberry Pi touchscreen. Then it got incidents, then a calendar, metrics, findings and approvals. I started opening it on my phone, and a web page made for a wall screen just isn’t a phone app. So on 30 October I started the iPhone app.
The stack:
- The board is written in Go, with MariaDB for acks, the audit
log, incidents and host keys. It’s a distroless, non-root image for amd64
and arm64 on Docker Hub as
graxo/pidash-server. - The app is React Native with Expo and Expo Router, with native iOS pieces where it matters: Swift Charts for the metrics, SwiftUI controls, Face ID, the keychain and a Notification Service Extension for the encrypted pushes. The terminal is xterm.js in an Expo DOM component, with a key row for Esc, Tab, Ctrl and the arrows.
- Releases: a version tag in GitLab builds the app with EAS and submits
it to TestFlight. A merge to the board’s
mainbranch runs the tests and deploys to my own Pi. - The website, pidash.io, is plain static HTML and CSS with no third-party requests, served by nginx behind BunkerWeb like everything else here.
And, like the Emby plugin, I did built it with the help of my personal assistant called Claude Code. This time I went a step further and set up what I call the factory: a pipeline of Claude agents that takes a feature request from idea to merge request.
feature request
  → spec writer   (writes the spec, asks me the open questions)
  → builder       (writes the code, runs the tests and gitleaks)
  → reviewers     (security, UX, UI and code, in parallel)
  → fix rounds    (at most two, then a human looks)
  → approver      (re-runs the checks, opens a merge request)
  → me            (I test it and merge, the pipeline deploys)
(More on this later, in another post)
Run it on your own homelab
You need:
- An iPhone
- A Raspberry Pi 4 or 5 (2 GB or more), or any Linux machine, with Docker 28+
- At least one Alertmanager
- An OIDC provider (Authentik, Keycloak, …) that puts a
groupsclaim in its ID token - A TLS reverse proxy for the board’s address (Caddy, nginx, Traefik, …) or access it through Tailscale.
For approvals and runbooks you also need AWX, with your own Ansible roles, job templates and workflows already in it. PiDash connects to them; you still write and maintain the automation yourself.
To give you a head start, I’ll soon publish some of my own Ansible roles, playbooks and AWX workflows here on koper.dev, the ones I use with PiDash every day. Take them as they are or use them as a starting point for your own.
The quickest way to install the board is the one-line installer, which asks for your addresses and fills in the config:
curl -fsSL https://pidash.io/install/setup | sh
Prefer to see what you’re running first? Download it and read it, or follow the install guide, which does the same steps by hand and also covers a board without internet access. The docs list every connection and the least rights each one needs.
Then install the app from TestFlight, enter your board’s address and sign in through your own identity provider.
I’m looking for 50 beta testers
The app is in TestFlight and I’m looking for 50 people with a homelab to try it on. The board is free, and during the beta the app is free too, with every feature unlocked.
What I’d love to hear about:
- How the install went, and where the docs left you guessing
- Systems you’d want it to connect to that it doesn’t yet
- Anything that breaks, looks off or feels slow
To join:
- Install TestFlight from the App Store.
- Open the PiDash beta link on your iPhone and install PiDash.
- Set up the board with the install guide.
Feedback goes through TestFlight’s own “Send Beta Feedback”, or by mail to support@koper.cloud. Everything else is on pidash.io.
PiDash is iPhone only for now. No Android version yet, but the board itself works in any mobile browser, acks and silences included.